Data Preprocessing
Dataset Overview
The dataset we used in this analysis is from the site Inside Airbnb. The listing meta data consists of 36938 listings with 96 features, including neighborhood information like neighborhood overview, availability information like available days in 30, 60 and 365, host information like host response rate, the total listing count of the host, host identify verfication and review information like review score rating etc.
Data Cleansing
In order to feed the data into WEKA, I did the following data cleansing step:
1. Transforming norminal features into multi-dimensional binary features.
2. Interpolationg missing data with the mean of the corresponding features.
3. Removing duplicate listing instances with the same listing id.
4. Normalizing all the numerical features by unity based normalization.
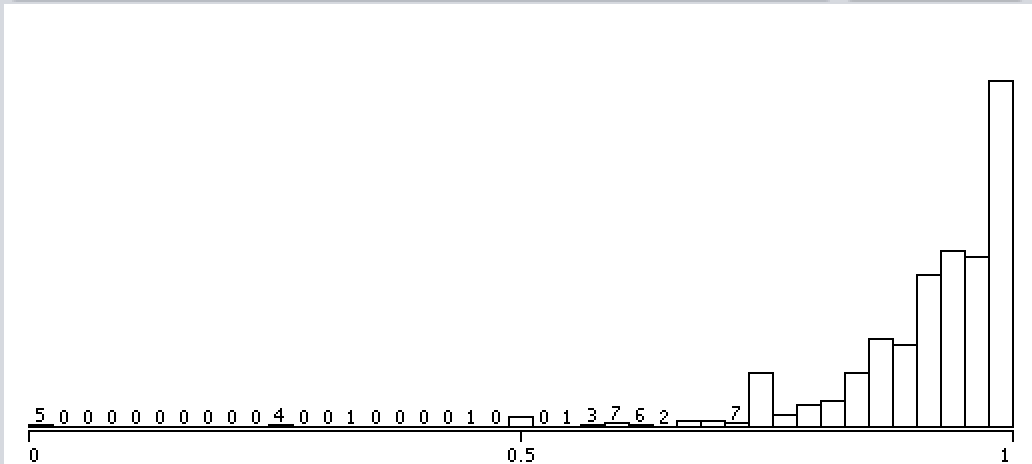
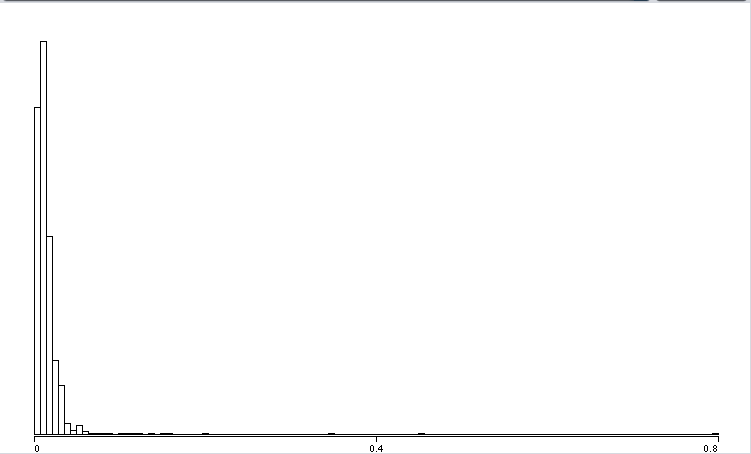
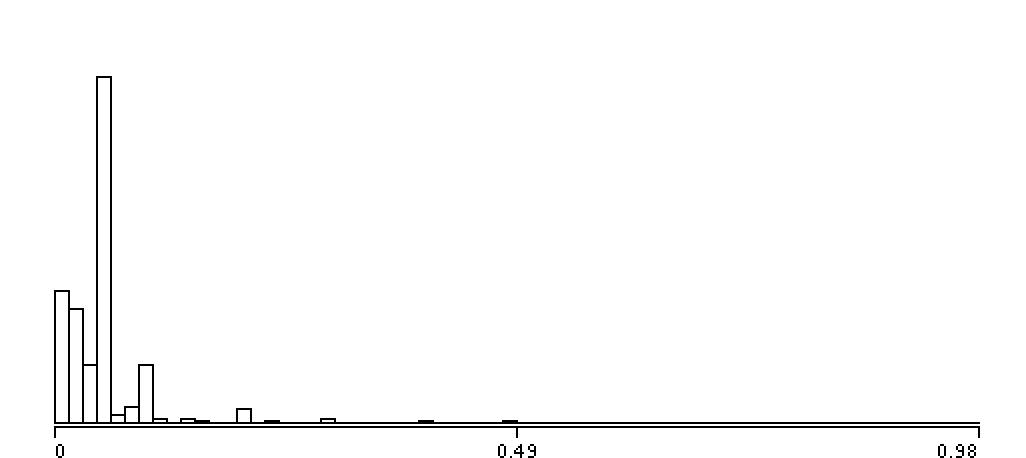
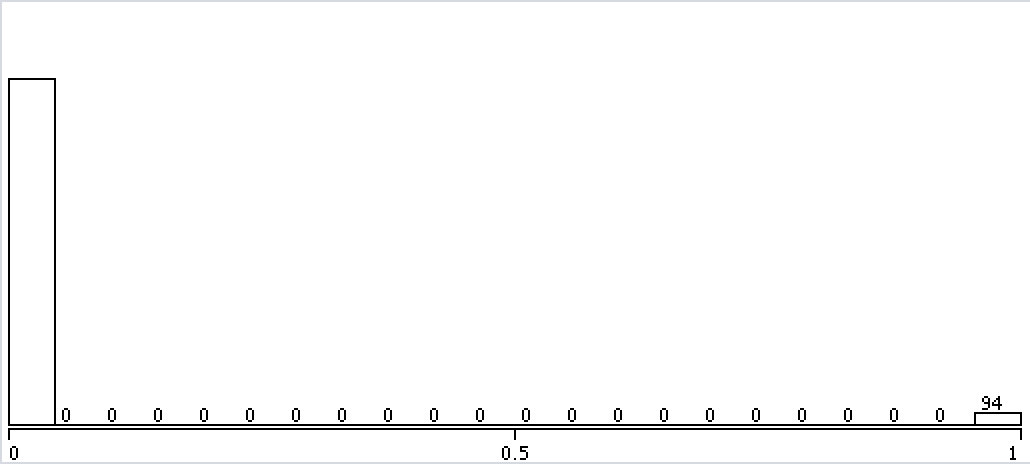
The following are the 12 selected feature distribution after normalization and interpolation.


Feature Selection
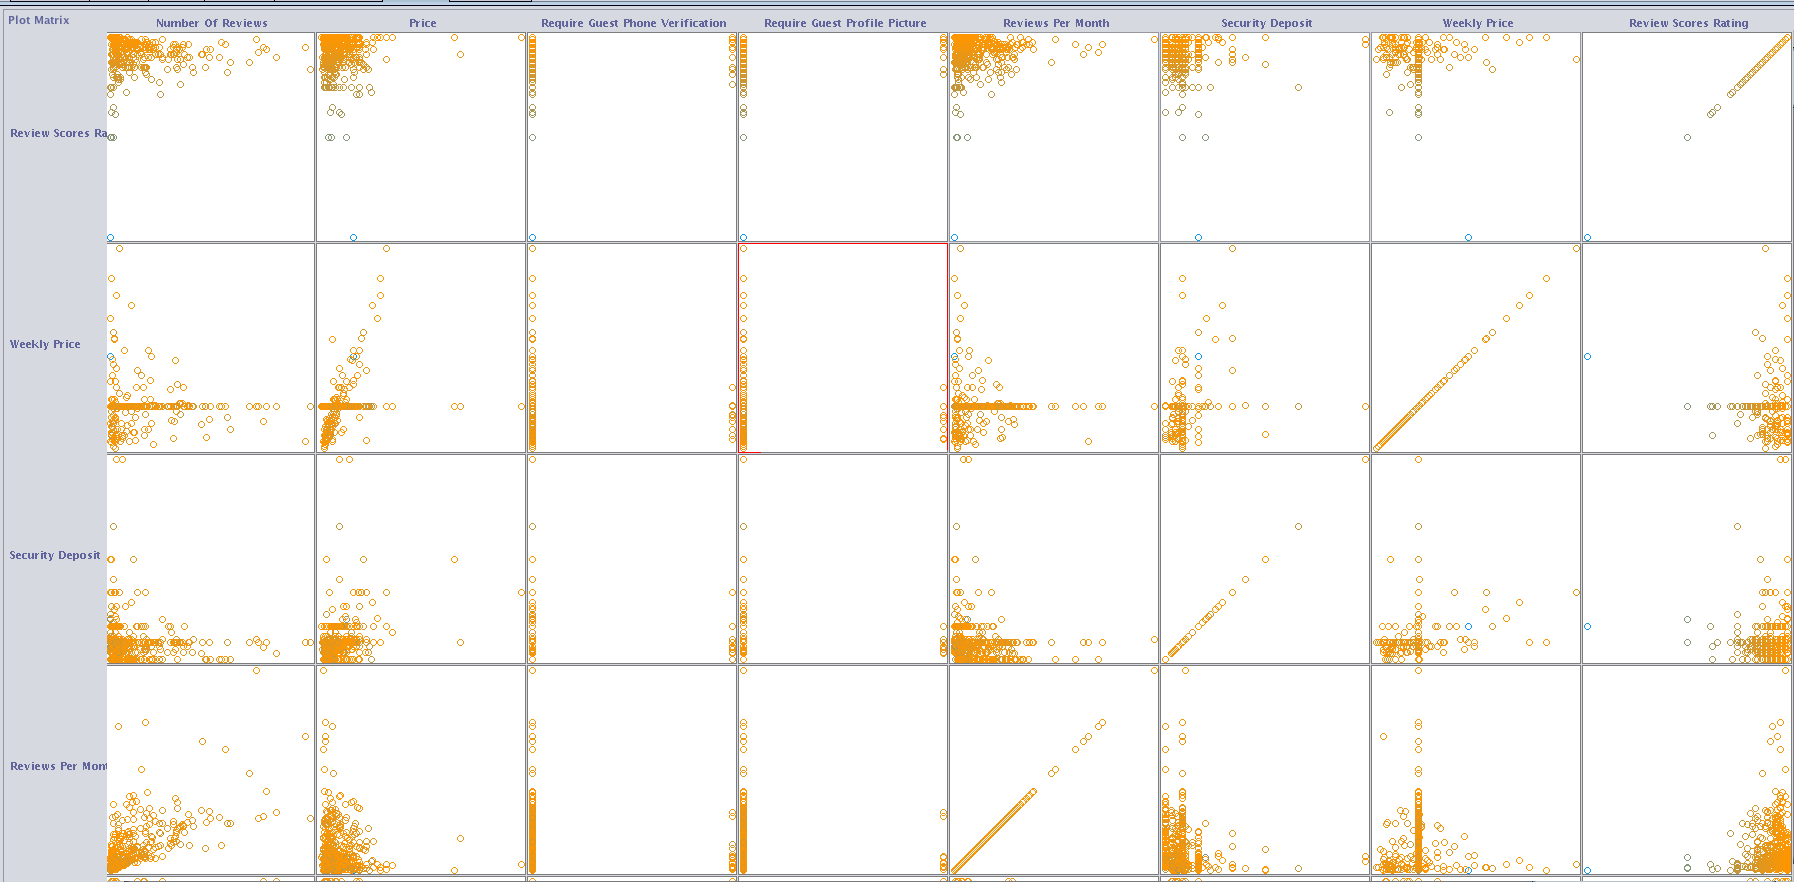
Before performing feature selection, we first investigate the dependency of the 96 features in WEKA by visualizing the pairwise correlation of the features. A snapshot of the correlation graph is shown below. From the graph we can see that there is no strong correlation between any of the two features, indicating that the features are mostly independent.
Based on the independence of the features, we can calculate the information gain (also called entropy) for each attribute for the output variable with InfoGainAttributeEval Attribute Evaluator in WEKA. Entry values vary from 0 (no information) to 1 (maximum information). Those attributes that contribute more information will have a higher information gain value and can be selected, whereas those that do not add much information will have a lower score and can be removed.With this, we reduced the number of features from 96 to 56 with the most information gain.